Telemetry Configuration Guide
Introduction
Telemetry is a technology that enables high-speed remote data collection from network devices. It facilitates rapid fault isolation and efficient, intelligent network operations. Monitored devices proactively and in real time push their own metrics (such as CPU, memory, and traffic statistics), logs, and events to a collector or analytics platform. This model replaces traditional pull-based monitoring mechanisms, such as SNMP polling.
gRPC (Google Remote Procedure Calls) is a high-performance, general-purpose open-source RPC framework released by Google in 2015. It is built on the HTTP/2 protocol and supports interface definition using Protocol Buffers, with data transmitted in binary encoding. It also provides cross-platform capabilities. Both communication parties perform secondary development based on this framework. gRPC handles transport, security, and encoding, allowing developers to focus on application-layer interface definition and implementation.
Telemetry reports encoded data to the collector over the gRPC protocol for reception and storage. The default data encoding format is JSON_IETF, which is a YANG JSON encoding strictly defined in IETF RFC 7951.
Basic Concepts
Subscription Modes
Telemetry supports two subscription modes: Dial-in and Dial-out. The difference lies in the roles of the device and the collector.
- Dial-in Mode
In Dial-in mode, the device acts as the server and the collector acts as the client. The collector actively establishes a connection to the device and listens for data to perform collection. The device-side configuration is relatively simple. This mode is suitable for short-term state monitoring.
- Dial-out Mode
In Dial-out mode, the device acts as the client and the collector acts as the server. The device proactively initiates a connection to the collector and pushes telemetry data. This mode is more suitable for long-term monitoring in large-scale networks.
Reporting Modes
In Dial-in mode, the device supports two data reporting modes: stream and poll.
- In stream mode, subscriptions support:
- on-change: Reports data only when a change occurs.
- sampled: Reports data periodically at a specified interval.
- In poll mode, data is retrieved through explicit polling requests initiated by the collector.
In Dial-out mode, the device supports periodic and stream reporting modes.
- In periodic mode, the device sends data at regular intervals.
- In stream mode, data transmission is triggered by changes.
Different reporting modes support different collection targets and YANG paths.
Collection Targets
Collection targets are classified into DB and non-DB types.
In Dial-in mode, the supported DB targets include:
- APPL_DB
- ASIC_DB
- COUNTERS_DB
- LOGLEVEL_DB
- CONFIG_DB
- PFC_WD_DB
- FLEX_COUNTER_DB
- STATE_DB
For non-DB targets:
- OTHERS (OTHERS is a system-defined target type for non-database data).
In Dial-out mode, the supported DB targets include:
- COUNTERS_DB
- STATE_DB
For non-DB targets:
- OTHERS
Collection Paths
For DB-type data, users can create custom events for data collection. The collection path supports the following formats:
- <TABLE>
- <TABLE>/<KEY>
- <TABLE>/<KEY>/<Field>
In addition, the system supports a set of predefined collection paths, also referred to as virtual paths, as listed below.
Table 1 DB-Type Events
Event Name | Target | Virtual Path | Description |
|---|---|---|---|
Total Ingress/Egress PFC Packets | COUNTERS_DB | COUNTERS/Ethernet*/pfc_cnt | - |
Total Ingress Packet Loss | COUNTERS_DB | COUNTERS/Ethernet*/ingress_loss_cnt | Collects packet drops caused by buffer overflow. Not supported on -N-V2 models. |
Total Egress Packet Loss | COUNTERS_DB | COUNTERS/Ethernet*/queue_egress_loss_cnt | - |
Queue Transmitted Bytes | COUNTERS_DB | COUNTERS/Ethernet*/queue_transmitted_bytes | - |
Queue Dropped Bytes | COUNTERS_DB | COUNTERS/Ethernet*/queue_dropped_bytes | - |
Queue Transmitted Packets | COUNTERS_DB | COUNTERS/Ethernet*/queue_transmitted_packets | - |
Queue Dropped Packets | COUNTERS_DB | COUNTERS/Ethernet*/queue_dropped_packets | - |
IPv4 Traffic Statistics | COUNTERS_DB | COUNTERS/Ethernet*/ip_status | Not supported on -N-V2 models. |
IPv6 Traffic Statistics | COUNTERS_DB | COUNTERS/Ethernet*/ipv6_status | - |
Traffic Statistics Summary | COUNTERS_DB | COUNTERS/Ethernet*/pkt_status | Includes packet drops, error packets, and BUM traffic statistics. |
NOTE:
The asterisk (*) indicates a wildcard. For example:
- COUNTERS/Ethernet*/pfc_cnt collects PFC statistics for all Ethernet interfaces.
- COUNTERS/Ethernet0/pfc_cnt collects PFC statistics for Ethernet0 only.
If non-DB-type data is collected, the following fixed paths are supported.
Table 2 Non-DB-Type Events
Event Name | Path Target | Path |
|---|---|---|
Logs of configuration operations | OTHERS | cmd/history |
CPU Utilization | OTHERS | platform/cpu |
Memory Statistics | OTHERS | proc/meminfo |
I/O Statistics | OTHERS | proc/diskstats |
System Load Average | OTHERS | proc/loadavg |
Virtual Memory Statistics | OTHERS | proc/vmstat |
CPU and System-Level Statistics | OTHERS | proc/stat |
Default Telemetry Configuration
The default Telemetry configuration is shown in the table below.
Table 3 Default Telemetry Configuration
Parameter | Default Value |
|---|---|
Telemetry Feature | Enabled |
Telemetry Destination Collector | Not configured |
Telemetry Subscription | Not configured |
Telemetry Data Reporting Interval | 5000 ms |
Data Encoding Format | JSON_IETF |
Configuring Telemetry in Dial-in Mode
The gRPC service is enabled by default and listens on all interfaces. No manual configuration is required. Ensure that Layer 3 connectivity between the device and the collector is reachable.
NOTE: The gRPC service can be disabled using the command feature telemetry state disable.
Configuring Telemetry in Dial-out Mode
Configuring the Telemetry Client
Table 4 Telemetry Client Configuration
Operation | Command | Description |
|---|---|---|
Enter global configuration mode | configure terminal | - |
Enter Telemetry client configuration mode | telemetry client | - |
Create a Telemetry destination group | destination-group destination_group_name | - |
Configure the collector IP address and port | {ipv4-address A.B.C.D | ipv6-address A::B} port port-number | A.B.C.D/A::B: Collector address. Should be Layer 3 reachable from the device. port-number: Collector listening port. Only one collector can be configured per destination group. Configure multiple destination groups if multiple collectors are required. |
Configuring Telemetry Subscriptions
Table 5 Telemetry Subscription Configuration
Operation | Command | Description |
|---|---|---|
Enter global configuration mode | configure terminal | - |
Enter Telemetry client configuration mode | telemetry client | - |
Create a Telemetry subscription and enter its configuration mode | subscription subscription_name | - |
Bind a destination group to the subscription | destination-group destination_group_name | The subscription should be bound to a destination group before communication can be established. Each subscription supports only one destination group. |
Configure the collection target | path-target [COUNTERS_DB|STATE_DB|OTHERS] | Each subscription supports only one collection target. |
Configure collection paths | paths path-name | Refer to Collection PathsCollection Paths for the path format. Multiple paths can be configured per subscription. |
Configure reporting mode | report-type [periodic|stream] | - |
(Optional) Configure reporting interval when periodic mode is used | report-interval interval | Unit: milliseconds. Range: 100 to 1,800,000. Default: 5000 ms. |
Display and Maintenance
Table 6 Telemetry Display and Maintenance
Operation | Command | Description |
|---|---|---|
Display Telemetry client configuration | show telemetry-client summary | - |
Display Telemetry destination group configuration | show telemetry-client destination-group [destination_group_name] | - |
Display Telemetry subscription configuration and status | show telemetry-client subscription [all|subscription_name] | - |
Typical Configuration Examples
Configuring Dial-out Telemetry to Subscribe to Packet Loss Statistics
- Network Requirement
As the network scale increases, users need to optimize and troubleshoot the network based on device statistics. For example, when packet loss occurs on the device, the device reports the data to the collector. This enables timely traffic monitoring and performance tuning.
- Network Topology

- Configuration Steps
Step 1: Configure the interface IP address.
sonic# configure terminal
sonic(config)# interface ethernet 0/0
sonic(config-if-0/0)# ip address 10.0.0.2/24
Step 2: Configure the collector.
The collector uses OpenTelemetry Collector. The sample configuration is shown below:
receivers:
  otlp:
    protocols:
      grpc:
        endpoint: "0.0.0.0:8081"
        tls:
          cert_file: "D:/programs/otelcol/server.crt"
          key_file: "D:/programs/otelcol/server.key"

exporters:
  file:
    path: "D:/programs/otelcol/exporters.json"
  logging:

service:
  pipelines:
    traces:
      receivers: [otlp]
      exporters: [file, logging]
    metrics:
      receivers: [otlp]
      exporters: [file, logging]
    logs:
      receivers: [otlp]
      exporters: [file, logging]
Ensure that Layer 3 connectivity between the device and the collector is established.
Step 3: Configure the Telemetry client.
sonic# configure terminal
sonic(config)# telemetry client
sonic(telemetry-client)# destination-group test
sonic(telemetry-destination-group-test)# ipv4-address 10.0.0.1 port 8081
sonic(telemetry-destination-group-test)# exit
sonic(telemetry-client)# subscription test
sonic(telemetry-subscription-test)# destination-group test
sonic(telemetry-subscription-test)# path-target COUNTERS_DB
sonic(telemetry-subscription-test)# paths COUNTERS/Ethernet0/queue_egress_loss_cnt
sonic(telemetry-subscription-test)# report-interval 10000
sonic(telemetry-subscription-test)# report-type periodic
sonic(telemetry-subscription-test)# exit- Verification
Verify that the OpenTelemetry Collector receives the reported data. Logging output and the exported file should contain the reported packet loss statistics.
# logging
2024-11-01T11:44:25.978+0800    info    TracesExporter  {"kind": "exporter", "data_type": "traces", "name": "logging", "resource spans": 1, "spans": 1}
2024-11-01T11:44:35.979+0800    info    TracesExporter  {"kind": "exporter", "data_type": "traces", "name": "logging", "resource spans": 1, "spans": 1}

# exporters.json
	{
		"resourceSpans": [
			{
			"resource": {
					"attributes": [
						{
							"key": "service.name",
							"value": {
								"stringValue": "grpc-dialout"
							}
						}
					]
				},
				"scopeSpans": [
					{
						"scope": {
							"name": "telemetry-dialout/client"
						},
						"spans": [
							{
								"traceId": "dc78f3671e112263b54dd5fa1a6fb45d",
								"spanId": "6818243589fca8ec",
								"parentSpanId": "",
								"name": "dialout-report",
								"kind": 1,
								"startTimeUnixNano": "1730432661299663511",
								"endTimeUnixNano": "1730432661299733369",
								"attributes": [
									{
										"key": "sonic-data",
										"value": {
											"stringValue": "update: <\n  timestamp: 1730432661296098535\n  prefix: <\n    target: \"COUNTERS_DB\"\n  >\n  update: <\n    path: <\n      elem: <\n        name: \"COUNTERS\"\n      >\n      elem: <\n        name: \"Ethernet0\"\n      >\n      elem: <\n        name: \"queue_egress_loss_cnt\"\n      >\n    >\n    val: <\n      json_ietf_val: \"{\\\"Ethernet0:0\\\":{\\\"queue_dropped_bytes\\\":\\\"0\\\",\\\"queue_dropped_packets\\\":\\\"0\\\",\\\"type\\\":\\\"unicast\\\"},\\\"Ethernet0:1\\\":{\\\"queue_dropped_bytes\\\":\\\"0\\\",\\\"queue_dropped_packets\\\":\\\"0\\\",\\\"type\\\":\\\"unicast\\\"},\\\"Ethernet0:2\\\":{\\\"queue_dropped_bytes\\\":\\\"0\\\",\\\"queue_dropped_packets\\\":\\\"0\\\",\\\"type\\\":\\\"unicast\\\"},\\\"Ethernet0:3\\\":{\\\"queue_dropped_bytes\\\":\\\"0\\\",\\\"queue_dropped_packets\\\":\\\"0\\\",\\\"type\\\":\\\"unicast\\\"},\\\"Ethernet0:4\\\":{\\\"queue_dropped_bytes\\\":\\\"0\\\",\\\"queue_dropped_packets\\\":\\\"0\\\",\\\"type\\\":\\\"unicast\\\"},\\\"Ethernet0:5\\\":{\\\"queue_dropped_bytes\\\":\\\"0\\\",\\\"queue_dropped_packets\\\":\\\"0\\\",\\\"type\\\":\\\"unicast\\\"},\\\"Ethernet0:6\\\":{\\\"queue_dropped_bytes\\\":\\\"0\\\",\\\"queue_dropped_packets\\\":\\\"0\\\",\\\"type\\\":\\\"unicast\\\"},\\\"Ethernet0:7\\\":{\\\"queue_dropped_bytes\\\":\\\"0\\\",\\\"queue_dropped_packets\\\":\\\"0\\\",\\\"type\\\":\\\"unicast\\\"}}\"\n    >\n  >\n>\n"
										}
									}
								],
								"events": [
									{
										"timeUnixNano": "1730432661299668184",
										"name": "telemetry-dialout"
									}
								],
								"status": {}
							}
						]
					}
				],
				"schemaUrl": "https://opentelemetry.io/schemas/v1.4.0"
			}
		]
	}
Configuring Dial-out Telemetry to Subscribe to PTP Status
- Network Requirement
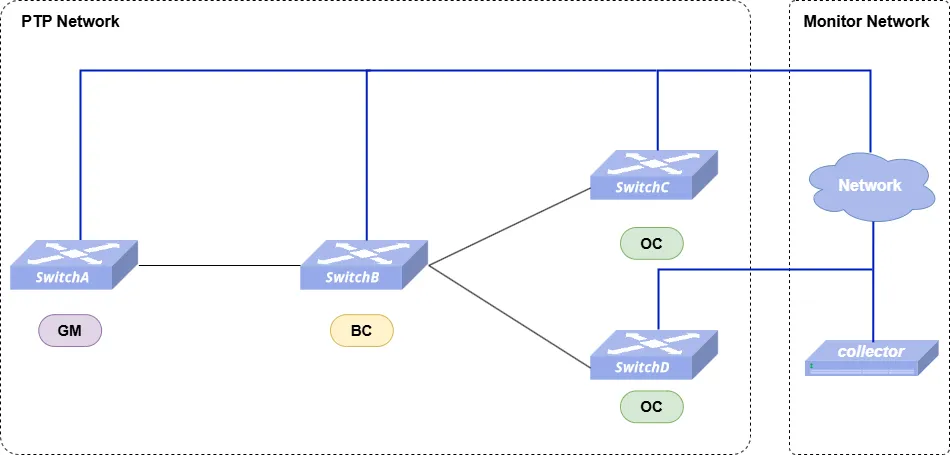
To meet visualization and O&M requirements for high-precision time synchronization, the user plans to deploy a time synchronization network based on PTP (Precision Time Protocol). Telemetry is introduced to monitor and centrally analyze PTP runtime status.
Requirements:
- Changes in the PTP GM Identity should be reported in real time.
- Other PTP information should be collected every 10 seconds.
- Network Topology
- Configuration Roadmap
- Configure PTP. (Omitted)
- Ensure Layer 3 connectivity between the device and the collector. (Omitted)
- Configure OpenTelemetry Collector on the collector. (Omitted)
- Configure Telemetry subscriptions on the device for GM Identity and other PTP data separately.
- Configuration Steps
Switch A is used as an example. Other devices are configured similarly.
Step 1: Configure the Telemetry destination group.
SwitchA# configure terminal
SwitchA(config)# telemetry client
SwitchA(telemetry-client)# destination-group ptp
SwitchA(telemetry-destination-group-ptp)# ipv4-address 10.250.0.247 port 4317
SwitchA(telemetry-destination-group-ptp)# exit
Step 2: Configure a subscription for GM Identity (real-time reporting).
SwitchA(telemetry-client)# subscription ptp_gmi
SwitchA(telemetry-subscription-ptp_gmi)# destination-group ptp
SwitchA(telemetry-subscription-ptp_gmi)# path-target STATE_DB
SwitchA(telemetry-subscription-ptp_gmi)# paths PTP_DOMAIN/127/config/grandmaster_clock_identity
SwitchA(telemetry-subscription-ptp_gmi)# report-type stream
SwitchA(telemetry-subscription-ptp_gmi)# exit
Step 3: Configure a subscription for other PTP information (periodic reporting).
SwitchA(telemetry-client)# subscription ptp
SwitchA(telemetry-subscription-ptp)# destination-group ptp
SwitchA(telemetry-subscription-ptp)# path-target STATE_DB
SwitchA(telemetry-subscription-ptp)# paths PTP_DOMAIN/127/config
SwitchA(telemetry-subscription-ptp)# report-type periodic
SwitchA(telemetry-subscription-ptp)# report-interval 10000- Verification
Verify the configuration:
- The destination group is configured correctly.
SwitchA# show telemetry-client destination-group
+--------+---------------------+---------------------+
| Name   | IPv4 Destinations   | IPv6 Destinations   |
+========+=====================+=====================+
| ptp    | 10.250.0.247:4317   |                     |
+--------+---------------------+---------------------+- The subscription state shows Sub-state: Success.
SwitchA# show telemetry-client subscription
+------------+---------------------+---------------+
| Name       | Destination-Group   | Path-Target   |
+============+=====================+===============+
| ptp        | ptp                 | STATE_DB      |
+------------+---------------------+---------------+
| ptp_gmi    | ptp                 | STATE_DB      |
+------------+---------------------+---------------+
SwitchA# show telemetry-client subscription ptp

==============================
NAME: ptp
Destination-Group : ptp
Path-Target       : STATE_DB
Report-Type       : periodic
Report-Interval   : 10000 ms
Paths:
    PTP_DOMAIN/127/config

Sub-state : Success
SwitchA# show telemetry-client subscription ptp_gmi

==============================
NAME: ptp_gmi
Destination-Group : ptp
Path-Target       : STATE_DB
Report-Type       : stream
Paths:
    PTP_DOMAIN/127/config/grandmaster_clock_identity

Sub-state : Success
Verify the OpenTelemetry Collector receives:
- Real-time updates when the PTP GM Identity changes.
2026-02-28T17:22:13.725+0800    info    Traces  {"resource": {"service.instance.id": "85227404-4820-42b6-b5c9-f712ee26258e", "service.name": "otelcol", "service.version": "0.141.0"}, "otelcol.component.id": "debug", "otelcol.component.kind": "exporter", "otelcol.signal": "traces", "resource spans": 1, "spans": 1}
2026-02-28T17:22:13.725+0800    info    ResourceSpans #0
Resource SchemaURL: https://opentelemetry.io/schemas/v1.4.0
Resource attributes:
     -> service.name: Str(grpc-dialout)
ScopeSpans #0
ScopeSpans SchemaURL:
InstrumentationScope telemetry-dialout/client
Span #0
    Trace ID       : 08d1d1bc54224c1da437c08bdc63619c
    Parent ID      :
    ID             : 1fa55528dbdffa3a
    Name           : dialout-report
    Kind           : Internal
    Start time     : 2026-02-28 09:21:42.084190055 +0000 UTC
    End time       : 2026-02-28 09:21:42.084201147 +0000 UTC
    Status code    : Unset
    Status message :
Attributes:
     -> sonic-data: Str(update: <
  timestamp: 1772270502084010719
  prefix: <
    target: "STATE_DB"
  >
  update: <
    path: <
      elem: <
        name: "PTP_DOMAIN"
      >
      elem: <
        name: "127"
      >
      elem: <
        name: "config"
      >
      elem: <
        name: "grandmaster_clock_identity"
      >
    >
    val: <
      string_val: "001000.fffe.000172"
    >
  >
>
)
Events:
SpanEvent #0
     -> Name: telemetry-dialout
     -> Timestamp: 2026-02-28 09:21:42.08419638 +0000 UTC
     -> DroppedAttributesCount: 0
        {"resource": {"service.instance.id": "85227404-4820-42b6-b5c9-f712ee26258e", "service.name": "otelcol", "service.version": "0.141.0"}, "otelcol.component.id": "debug", "otelcol.component.kind": "exporter", "otelcol.signal": "traces"}
- Periodic reports of other PTP information every 10 seconds.
2026-02-28T17:20:36.266+0800    info    Traces  {"resource": {"service.instance.id": "85227404-4820-42b6-b5c9-f712ee26258e", "service.name": "otelcol", "service.version": "0.141.0"}, "otelcol.component.id": "debug", "otelcol.component.kind": "exporter", "otelcol.signal": "traces", "resource spans": 1, "spans": 1}
2026-02-28T17:20:36.266+0800    info    ResourceSpans #0
Resource SchemaURL: https://opentelemetry.io/schemas/v1.4.0
Resource attributes:
     -> service.name: Str(grpc-dialout)
ScopeSpans #0
ScopeSpans SchemaURL:
InstrumentationScope telemetry-dialout/client
Span #0
    Trace ID       : bc7e948d7e79cf6eff2b066fe9b7ef4a
    Parent ID      :
    ID             : 4c8898c6bd4541a7
    Name           : dialout-report
    Kind           : Internal
    Start time     : 2026-02-28 09:20:03.68683352 +0000 UTC
    End time       : 2026-02-28 09:20:03.686940305 +0000 UTC
    Status code    : Unset
    Status message :
Attributes:
     -> sonic-data: Str(update: <
  timestamp: 1772270403686610270
  prefix: <
    target: "STATE_DB"
  >
  update: <
    path: <
      elem: <
        name: "PTP_DOMAIN"
      >
      elem: <
        name: "127"
      >
      elem: <
        name: "config"
      >
    >
    val: <
      json_ietf_val: "{\"clock_accuracy\":\"fe\",\"clock_class\":\"248\",\"clock_priority1\":\"125\",\"clock_priority2\":\"128\",\"clock_step\":\"two_step\",\"clock_type\":\"bc\",\"domain\":\"127\",\"grandmaster_clock_accuracy\":\"fe\",\"grandmaster_clock_class\":\"248\",\"grandmaster_clock_identity\":\"001000.fffe.000173\",\"grandmaster_clock_priority1\":\"10\",\"grandmaster_clock_priority2\":\"128\",\"local_clock_identity\":\"000000.fffe.109109\",\"local_ts\":\"257052135973854\",\"master_clock_identity\":\"000000.0000.000000\",\"max_steps_removed\":\"255\",\"offset_to_master\":\"1\",\"parent_port_num\":\"1\",\"path_delay\":\"250\",\"servo_state\":\"locked\"}"
    >
  >
>
)
Events:
SpanEvent #0
     -> Name: telemetry-dialout
     -> Timestamp: 2026-02-28 09:20:03.686840264 +0000 UTC
     -> DroppedAttributesCount: 0
        {"resource": {"service.instance.id": "85227404-4820-42b6-b5c9-f712ee26258e", "service.name": "otelcol", "service.version": "0.141.0"}, "otelcol.component.id": "debug", "otelcol.component.kind": "exporter", "otelcol.signal": "traces"}